30-Second Summary
| Legs | Buy 1 lower-strike call · Sell 2 higher-strike calls (same expiry) |
| Cost | Net credit (premium received) |
| Max Profit | At the short strikes: credit + (spread width × 100) |
| Max Loss | Unlimited above the upper breakeven |
| Breakevens | Upper: short strike + (max profit ÷ 100) |
| Ideal Outcome | Underlying pins near the short strikes at expiration |
| Avoid When | You expect a large upside move — the short 2× leg is unhedged above the long |
The ratio spread is the inverse of the back spread. Instead of buying volatility cheaply, you sell it aggressively — collecting more premium than a simple vertical spread, but exposing yourself to unlimited loss if the underlying surges past the uncovered short leg.
What Is a Call Ratio Spread?
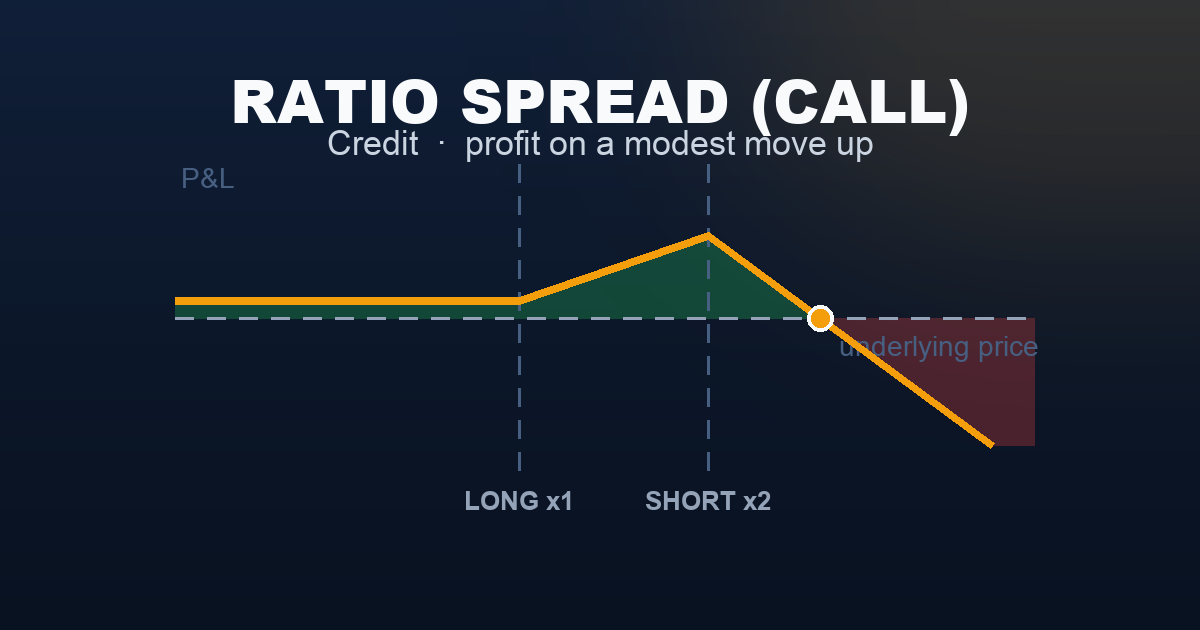
A call ratio spread involves buying one lower-strike call and selling two higher-strike calls — all at the same expiration.
You collect a net credit at entry. If the underlying stays below the short strikes or moves modestly up to them, you keep the credit plus the profit from the long call. But above the short strikes, you are effectively short one uncovered call — and losses are unlimited.
How it differs from a vertical spread:
- A bull call spread: buy 1 lower, sell 1 higher — capped upside, capped loss
- A ratio spread: buy 1 lower, sell 2 higher — higher credit, max profit at the short strike, unlimited loss above
The trade-off: You collect significantly more premium than a vertical spread, but you take on naked short exposure above the long strike. This is why it is classified as an expert-level strategy.
Two variants:
- Call ratio spread (covered here) — mildly bullish bias, profits when underlying pins near the short strikes
- Put ratio spread — mildly bearish, buy 1 higher put, sell 2 lower puts
Setup & Execution
| Leg | Action | Strike | DTE | Premium | Cash Flow |
|---|---|---|---|---|---|
| Long Call | Buy 1 | 7,500 | 30 | $80.00 | −$8,000 |
| Short Call ×2 | Sell 2 | 7,550 | 30 | $44.00 ea | +$8,800 |
| Net | +$800 credit |
- Long strike: 7,500 (ATM)
- Short strikes: 7,550 × 2 (OTM)
- Strike width: 50 points
- Net credit: +$800
- Max profit: +$800 + (50 × 100) = +$5,800 at SPX 7,550 at expiry
- Upper breakeven: 7,550 + ($5,800 ÷ 100) = 7,608
- Below 7,500: +$800 (keep the credit flat)
Execution note: Enter as a net limit order. VIX elevated at 22 makes the short calls worth more, improving the credit. A common approach is to target a credit of at least 30–40% of the spread width.
The Payoff Diagram

| SPX at Expiry | Buy 1 × 7,500 Call | Sell 2 × 7,550 Calls | Net P&L |
|---|---|---|---|
| 7,350 | $0 | $0 | +$800 |
| 7,450 | $0 | $0 | +$800 |
| 7,500 | $0 | $0 | +$800 |
| 7,525 | +$2,500 | $0 | +$3,300 |
| 7,550 | +$5,000 | $0 | +$5,800 ← max profit |
| 7,608 | +$10,800 | −$11,600 | $0 ← upper BE |
| 7,650 | +$15,000 | −$20,000 | −$4,200 |
The Seller’s Reality
The ratio spread is a seller’s trade — net short options — so time decay and IV contraction work in your favor. But selling 2 calls while buying only 1 means you have an uncovered short call above the long strike. This is where the danger lives.
Brokers require significant margin. The uncovered short call above 7,550 will require margin similar to a naked short call. Most brokers require full options approval (Level 4–5) and substantial account equity.
The strategy has a high win rate in quiet markets — but when it loses, it can lose large. A 10% rally that takes SPX from 7,500 to 8,250 would produce a theoretical loss of hundreds of thousands of dollars on one SPX ratio spread. Traders typically define maximum acceptable loss levels and set stops well before the upper breakeven.
Understanding the Greeks
| Greek | Value at Entry | What It Means |
|---|---|---|
| Delta | Near zero to mildly negative | Slightly bearish above the long strike due to the extra short |
| Gamma | Negative | Hates large moves; losses accelerate rapidly above the short strikes |
| Theta | Positive | Time decay works in your favor — earns daily in quiet markets |
| Vega | Negative | Benefits from IV compression; enter in elevated IV environments |
| Rho | Near zero | Minimal interest rate sensitivity |
Negative gamma is the defining risk. Above the short strikes, gamma turns against you — every point SPX rises costs more than the last. This is the opposite of the back spread. Positive theta and negative vega reward patient sellers in high-IV, range-bound markets.
Trade Management
- Take profit at 50–75% of max profit. A common approach is to close the spread when P&L reaches +$3,000–+$4,000 rather than holding for the full +$5,800. This reduces time in the trade and eliminates late-expiry risk.
- Set a hard stop at the upper breakeven. If SPX approaches 7,608, exit the entire position. The rate of loss above that level accelerates sharply due to negative gamma.
- Hedge the uncovered short if the underlying surges. Some traders buy a further OTM call to cap the upside risk when the trade moves against them — effectively converting it into an iron condor or butterfly.
- Close 10–14 DTE. As expiration nears and gamma risk peaks, holding the uncovered short becomes increasingly dangerous. Time value erosion is largely captured by this point.
Real-World Example
Scenario A — The Perfect Pin (Win): SPX opens at 7,500, VIX at 22. Traders expect a quiet month with no major catalysts. The ratio spread is entered for +$800. SPX grinds to 7,547 by expiry.
At 7,547:
- Long 7,500 call: +$4,700
- Short 2 × 7,550 calls: $0 (still OTM)
- Net P&L = +$800 + $4,700 = +$5,500 (near max profit)
The trader exits the day before expiry and collects 95% of max profit.
Scenario B — The Breakout (Loss): Same entry. An unexpected Fed statement triggers a risk-on rally. SPX surges to 7,640 in two sessions.
At 7,640:
- Long 7,500 call: +$14,000
- Short 2 × 7,550 calls: −$18,000
- Net P&L = +$800 + $14,000 − $18,000 = −$3,200
The trader had a stop at 7,608. They exited at approximately 7,610 for a loss near −$600, well before the full damage materialized.
When to Use
Use a ratio spread when:
- IV is elevated (VIX above 20) — you collect more premium on the two short calls
- You expect the underlying to make a modest move toward the short strikes and stall
- You want to express a mildly bullish view with a high probability of profit
- You are comfortable managing an uncovered short position with a hard stop
Avoid a ratio spread when:
- A major catalyst (FOMC, earnings) is upcoming — unexpected breakouts above the short strikes can cause large losses
- IV is low — the collected credit may not compensate for the unlimited short risk
- You cannot monitor the position daily — the uncovered short leg requires active management
Strategy Ladder
| Direction | Strategy | Why |
|---|---|---|
| ← Simpler | Bull Call Spread | Capped upside and capped loss — no uncovered short exposure |
| ← Simpler | Short Call Spread | Credit spread, fully defined risk |
| → This strategy | Call Ratio Spread | Higher credit, max profit at short strike, unlimited upside risk |
| ↔ Mirror | Back Spread | Inverse structure — buy 2, sell 1 — profits from explosive moves |
| ↑ Complex | Jade Lizard | Adds a short put to create a three-legged no-upside-risk structure |
This content is for educational purposes only and does not constitute financial or investment advice. Options trading involves significant risk of loss. Always consult a qualified financial professional before trading.