30-Second Summary
| Legs | Sell 1 lower-strike call · Buy 2 higher-strike calls (same expiry) |
| Cost | Small net debit (often near zero) |
| Max Profit | Unlimited — grows as underlying surges past the upper breakeven |
| Max Loss | At the long strike: (spread width × 100) + net debit |
| Breakeven | Upper: long strike + (max loss ÷ 100) |
| Ideal Outcome | Underlying makes a large, fast upside move before expiration |
| Avoid When | IV is already elevated — you overpay for the two long calls |
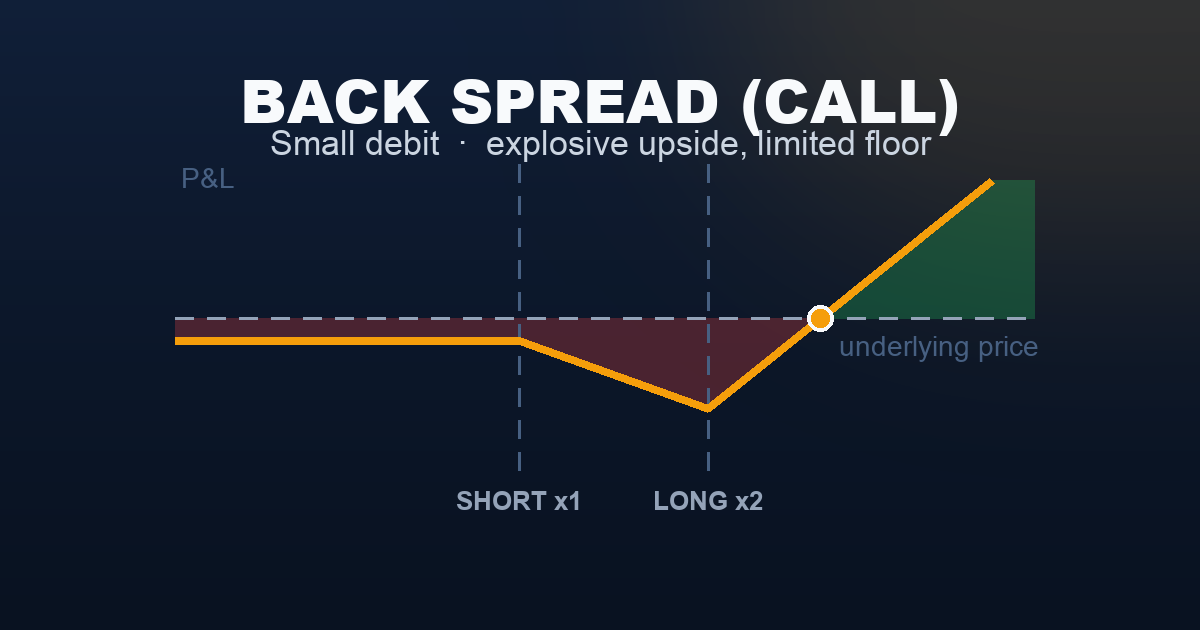
The back spread is a low-cost rocket-fuel bet. You pay almost nothing and give yourself unlimited upside exposure, with a defined (though painful) max loss if the underlying pins exactly at the long strike at expiration.
What Is a Call Back Spread?
A call back spread (also called a 1×2 ratio back spread) involves selling one lower-strike call and buying two higher-strike calls — all at the same expiration.
The unusual feature: it can be entered for a very small debit — or even a small credit — yet provides unlimited upside participation. The one call you sell helps finance two cheaper calls you buy.
Why two long calls? One long call would replicate a vertical spread (limited upside). Two long calls means you carry extra long delta above the long strikes — your net position gains exposure on explosive moves.
The danger zone: If the underlying lands exactly at the long strike at expiration, the sold call has full intrinsic value while both long calls are worth zero. That is where max loss occurs.
Two variants:
- Call back spread (covered here) — profits from large upside moves
- Put back spread — the mirror: sell a higher-strike put, buy two lower-strike puts; profits from explosive downside
Setup & Execution
| Leg | Action | Strike | DTE | Premium | Cash Flow |
|---|---|---|---|---|---|
| Short Call | Sell 1 | 7,450 | 30 | $65.00 | +$6,500 |
| Long Call ×2 | Buy 2 | 7,500 | 30 | $35.00 ea | −$7,000 |
| Net | −$500 debit |
- Short strike: 7,450 (slightly OTM)
- Long strikes: 7,500 × 2 (ATM)
- Strike width: 50 points
- Net cost: −$500
- Max loss: (50 pts × 100) + $500 = −$5,500 at SPX 7,500 at expiry
- Upper breakeven: 7,500 + ($5,500 ÷ 100) = 7,555
- Below 7,450: −$500 (lose only the small debit)
Execution note: Enter as a net limit order, not leg-by-leg. Target a debit under $1.00 or a small credit. If the debit is too large, widen the strikes or increase DTE to reduce cost.
The Payoff Diagram

| SPX at Expiry | Sell 1 × 7,450 Call | Buy 2 × 7,500 Calls | Net P&L |
|---|---|---|---|
| 7,350 | $0 | $0 | −$500 |
| 7,400 | $0 | $0 | −$500 |
| 7,450 | $0 | $0 | −$500 |
| 7,475 | −$2,500 | $0 | −$3,000 |
| 7,500 | −$5,000 | $0 | −$5,500 ← max loss |
| 7,555 | −$10,500 | +$11,000 | $0 ← upper BE |
| 7,600 | −$15,000 | +$20,000 | +$4,500 |
| 7,650 | −$20,000 | +$30,000 | +$9,500 |
The Buyer’s Reality
The back spread is a pure buyer’s trade: you own more options than you sell. That means you benefit from everything buyers love — big moves and rising IV — and suffer from everything buyers hate — time decay and stagnation.
Win rate is low. The underlying must move substantially through the upper breakeven (7,555 in this example) to profit on the upside. Sideways markets, slow grinds, and IV collapses are all enemies.
But the risk-reward is asymmetric. A $500 max downside (if SPX stays below 7,450) versus theoretically unlimited upside is what makes this structure appealing for traders expecting a sharp, directional event.
The trap: Many traders enter this strategy just before a big event, only to watch the underlying move toward the long strike — not beyond it. IV often collapses after the event (“IV crush”), compressing the long calls’ value at exactly the wrong moment.
Understanding the Greeks
| Greek | Value at Entry | What It Means |
|---|---|---|
| Delta | ~+0.45 | Net long delta — modestly bullish; rises sharply above 7,500 |
| Gamma | Strongly positive | Loves large moves; profits accelerate as SPX surges |
| Theta | Negative | Daily time decay — the enemy; position bleeds if market stays quiet |
| Vega | Positive | Benefits from rising IV; ideal to enter when VIX is low |
| Rho | Near zero | Interest rate sensitivity minimal |
Gamma is the star here. With two long calls and one short call, the back spread is net long gamma — it accelerates in value as the move grows. This is the opposite of the ratio spread and iron condor.
Vega timing matters. Enter when IV is low (VIX 14–18) and an event is approaching. The rising IV before the event inflates your long calls. After the event, if the move is large enough, intrinsic value takes over from IV.
Trade Management
- Take profit at 50–100% gain. A move to SPX 7,600 delivers roughly +$4,500 on a $500 debit — that’s a 9× return. Traders typically take profits quickly rather than holding for maximum theoretical gain.
- Cut losses if the underlying drifts toward the long strike. If SPX is heading to 7,500 with 10 days left, the position is approaching max loss. A common approach is to exit before it reaches the danger zone.
- Close 10–14 DTE regardless. As expiration approaches with SPX near the long strike, the max-loss zone becomes increasingly dangerous. Theta works against you; the structure has no value from waiting.
- Do not hold through expiration near the long strike. Max loss occurs exactly at 7,500 at expiry — staying in hoping for a last-minute move is one of the costliest mistakes with this strategy.
Real-World Example
Scenario A — The Explosive Move (Win): SPX is at 7,500 on a Tuesday before payrolls. Traders expect volatility. The back spread is entered for −$500. Friday morning, payrolls blow out estimates. SPX gaps to 7,591 at the open.
At 7,591:
- Sell 7,450 call: worth $14,100 (loss)
- Buy 2 × 7,500 calls: worth 2 × $9,100 = $18,200 (gain)
- Net P&L = +$18,200 − $14,100 − $500 = +$3,600
The trader exits at the open for a 7.2× return on risk.
Scenario B — The Pin (Loss): Same entry. SPX drifts sideways all month and settles at 7,498 on expiration Friday.
- Sell 7,450 call: worth $4,800 (loss)
- Buy 2 × 7,500 calls: worth $0
- Net P&L = −$4,800 − $500 = −$5,300 (near max loss)
The trader held through expiration hoping for a Friday rally. It never came.
When to Use
Use a back spread when:
- A scheduled catalyst (FOMC, earnings, CPI) could produce a sharp directional move
- IV is currently low (VIX under 18) — you want to buy volatility cheaply
- You have a strong directional bias but want to limit capital at risk
- You want unlimited upside without tying up large capital in a long call
Avoid a back spread when:
- IV is already elevated — you’re overpaying for the two long calls
- The underlying has been trending slowly — slow grinds will not reach the upper breakeven
- You expect a range-bound, low-volatility environment — theta will erode the position daily
- You cannot monitor closely — this trade needs active management near the long strike
Strategy Ladder
| Direction | Strategy | Why |
|---|---|---|
| ← Simpler | Long Call | Pure bullish bet, simpler, full premium cost |
| ← Simpler | Bull Call Spread | Capped upside, but much cheaper than a long call |
| → This strategy | Call Back Spread | Near-zero cost, unlimited upside, dangerous max-loss zone |
| ↔ Mirror | Ratio Spread | The opposite — sell 2, buy 1 — profits from stagnation |
| ↔ Put version | Put Back Spread (coming soon) | Same structure, bearish direction |
This content is for educational purposes only and does not constitute financial or investment advice. Options trading involves significant risk of loss. Always consult a qualified financial professional before trading.